

- Heating
- Posted
Heat pumps & mechanical ventilation start to dominate new homes market
Heat pumps were likely the dominant heating system in new Irish homes in 2017, and mechanical ventilation was on course to overtake natural ventilation in new homes in 2018, an analysis by Passive House Plus has revealed.
This article was originally published in issue 28 of Passive House Plus magazine. Want immediate access to all back issues and exclusive extra content? Click here to subscribe for as little as €10, or click here to receive the next issue free of charge
The new projections also indicate that BERs will eventually be issued for approximately 13,400 new homes built in 2018, with another 3,000+ one-off homes failing to comply with the requirement to obtain BERs prior to occupancy. The analysis was done using SEAI’s National BER Research Tool, combined with estimates based on commencement notices for one-off houses from the Building Control Management System.
By 22 November, 6,956 final BERs had been published for new homes built in 2018, compared to 5,080 BERs for 2017 homes published by the same date that year. The total for 2017 homes currently stands at 9,364 homes – a figure projected to increase by circa 400 once late BERs are published. The 2017 total includes only 588 one-off houses – namely homes listed as detached houses, where the BER was obtained for occupation by homeowner, rather than a sale. Circa 3,000 additional self builds are believed to be unaccounted for. The projections do not account for any impact that may arise if the state succeeds in driving up compliance rates in the self-build sector.
Heating systems & renewables
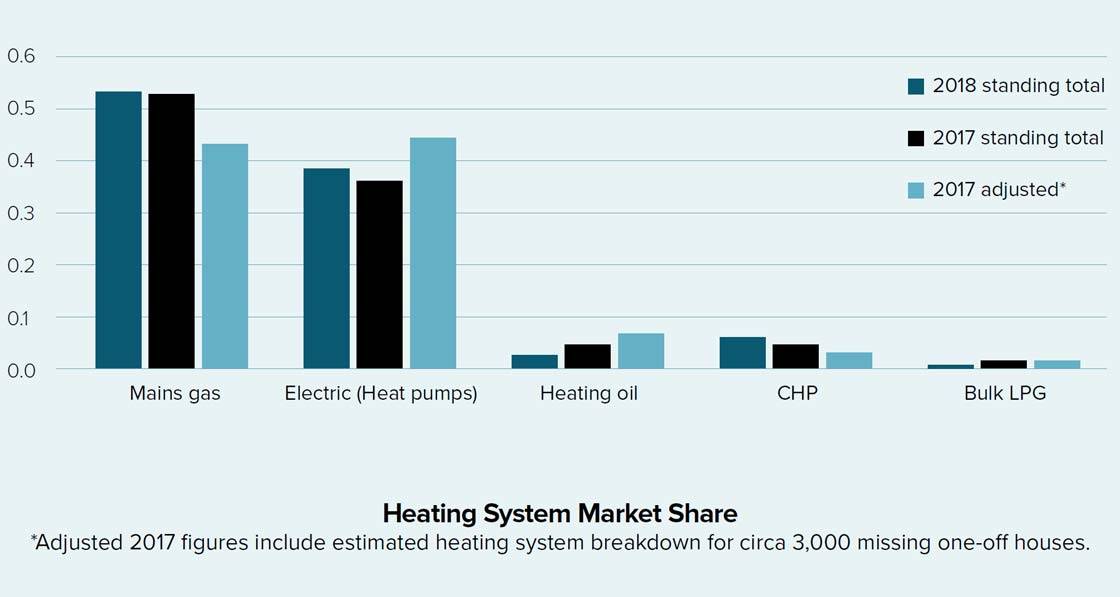
Of the homes built in 2017 with published final BERs – therefore excluding circa 3,000 one-off homes – heat pumps have 36.6% market share, with gas boilers at 52.6%, oil boilers at 4.1%, CHP at 5.8% and LPG at 0.8%. Based on the assumption that the missing homes have the same heating systems as the 588 one-off homes with BERs in 2018 (detached houses where the BER was obtained for occupation by homeowner, rather than for a sale) – 70% of which had heat pumps – the figures change dramatically. Heat pumps at 44.7% would become the most common heating system, gas boilers would fall to 42.8%, with oil boilers recovering somewhat to 7.8%, and CHP down at 4.4%.
Solar thermal systems were installed in 9.9% of new homes by 22 November 2018, down from 10.8% in 2017, continuing their declining market share in recent years. Unlike heat pumps, solar thermal doesn’t fare much better in one-off houses with BERs, indicating that its market share would be unlikely to rise by more than a point or two if the missing one-off houses were included. Meanwhile the market share of solar PV arrays – typically in conjunction with gas boilers – has increased marginally from 51.3% in 2017 homes to 51.8% of 2018 homes to date.
Mechanical ventilation
A swing towards mechanical ventilation – and whole house extract ventilation in particular – is evident in the 2018 homes. Of the 6,956 new homes entered to date for 2018 with final BERs, 24.6% include whole house extract ventilation – the category that includes the increasingly popular demand controlled mechanical extract ventilation systems.
Heat recovery ventilation is at 24.1%, while natural ventilation comes in at 50.2%, with positive input ventilation making up 01.1%. However, a markedly different picture emerges from the further 3,361 provisional BERs for homes being built in 2018, which lean disproportionately towards mechanical ventilation. Assuming this cohort of homes is built as per the specs in their provisional ratings, natural ventilation falls to 47.3%, heat recovery ventilation falls to 22.4% and whole house extract ventilation rises to 29.5%.
U-values
U-values for walls are on course to marginally improve – from 0.177 in 2017 to 0.173 in 2018, though that may change once late BERs for 2018 homes are published.
Excluding BERs with stated U-values of zero – as the Deap software assumes zero heat loss respectively for floors and ceilings of dwellings with heated spaces above or beneath – the average roof is on course to marginally improve from 0.131 in 2017 to 0.130 in 2018, with the average floor weakening from 0.137 in 2017 to 0.140 in 2018. Windows meanwhile have also marginally declined from an average of 1.20 in 2017 to 1.21 in 2018, with doors marginally improving from 1.48 in 2017 to 1.46 in 2018.
Thermal bridging
88.3% of new homes in 2018 used a thermal bridging factor (or Y-value) of 0.08 or worse. A value of 0.08 indicates the use of the Acceptable Construction Details, and a value of 0.15 is a default when neither ACDs or calculated Y-values have been used. The homes that used a value below 0.08 averaged a score of 0.0529. Y-values are added to the U-values of opaque elements in Deap.
Therefore, a wall U-value of 0.18 effectively rises to 0.26 if a Y-value of 0.08 is added. The effect on calculated heat loss is profound.
The 2018 homes with calculated Y-values saw their U-values rise to 0.22 (wall), 0.19 (roof) and 0.17 (floor), whereas homes with a Y-value of 0.08 saw their wall, roof and floor U-values rise to 0.25 (wall) 0.21 (roof) and 0.20 (floor) respectively, and the 10% that used a Y-value of 0.15 saw U-values rise to 0.32 (wall) and 0.26 (roof and floor).
Meanwhile average airtightness test results are on course to statistically tie – scoring an average q50 of 2.83 m3/hr/m2 at 50 Pa in 2018 and 2.82 in 2017, once those homes with a default airtightness q50 of 7 have been excluded.
Related items
-
 EU Electrification Action Plan to accelerate heat pump transition
 -
 A warts-and-all account of a landmark passive house conference
 -
 Life cycle assessment in construction and retrofit
 -
 Bio-based self-build fuses passive principles and clever shading proves heatwave-proof
 -
 Accessible Manchester retrofit delivers comfort and low bills
 -
 Ballymore scheme brings low-cost comfort to private market