

- NZEBs
- Posted
NZEB market update
Heat pumps rise, PV falls and fabric stands still.
This article was originally published in issue 37 of Passive House Plus magazine. Want immediate access to all back issues and exclusive extra content? Click here to subscribe for as little as €20, or click here to receive the next issue free of charge
The first wave of Irish homes built to the NZEB (nearly zero energy building) standard may be 18.5 per cent more energy efficient than homes built to the previous regulations, new analysis by Passive House Plus indicates. Meanwhile, a detailed picture of how the industry is complying with the NZEB standard is emerging – with heat pumps near ubiquitous, natural ventilation a rarity, solar PV dropping substantially, and improvements visible in airtightness, and window and door U-values.
The average home built to date to the 2019 version of Technical Guidance Document (TGD) L has a calculated primary energy score of 40.8 kWh/m2/yr – 18.5 per cent better than the 50 kWh/m2/yr for homes built to the 2011 regulations. Of homes built to TGD L 2019, 92.5 per cent are achieving A2 BERs, compared to 47.8 per cent of TGD L 2011 homes.
The analysis was based on data from SEAI’s National BER Research Tool, a database of all published BERs for Irish dwellings. The analysis focused on final BERs for new dwellings where the year of construction was 2019, 2020 or 2021, including homes built to 2011 and 2019 TGD L. Rather than give an overview of the average TGD L 2011 home built over the last decade – which would flatten out profound changes in specification over that period, such as the rise of heat pumps, mechanical ventilation and the decline of oil boilers – Passive House Plus has focused on data from 2019 onwards, to produce a more accurate indication of the extent of change as the industry worked out how to meet the new regulations.
As such the true extent of the gap between 2011 and 2019 TGD L may be even greater, given that the primary energy scores of new homes has improved incrementally since 2011, in large part due to the decarbonisation of electricity, which has led to substantial drops in the primary energy – or energy at source, rather than in the building - of grid electricity. It remains to be seen whether this fact may pose a risk to public confidence in NZEBs: one consequence is that the same house spec may achieve a substantially better BER score over time, solely due to the changing electricity factor.
Covid slowdown
A substantial slowdown in housing activity is evident in the data, an unsurprising finding given the impact of Covid-19 restrictions on the construction industry. By 11 March, the standing total of published BERs for homes built in 2019 and 2020 was 17,875 and 9,026 units respectively. However, a fairer reflection may be to compare BERs for homes built in a given year, where the BER is also published within the same year – given that a substantial proportion of BERs are published after the stated year of construction. In this case, the totals are 11,093 for 2019 and 7,772 for 2020.
The sample size for 2019 TGD L remains small, with BERs published for 2,814 homes subject to the new regulations, compared to 24,590 built to 2011 TGD L since the start of 2019. The results for 2019 must therefore be treated with some caution. The addition of a single development – such as a large apartment building – could quite considerably change the results.
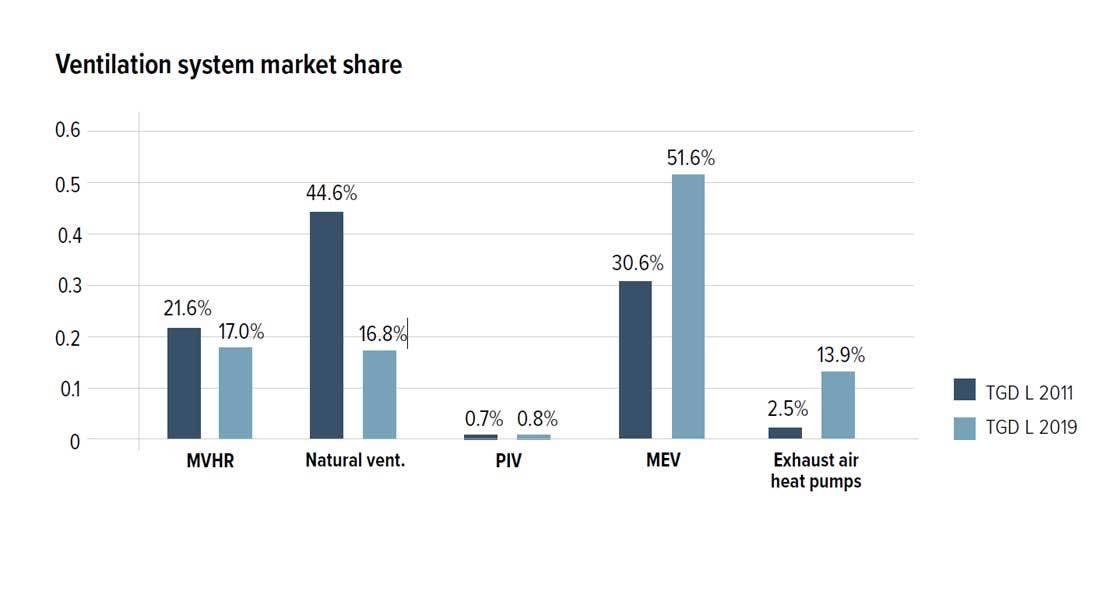
Heat pumps feature in 93 per cent of 2019 TGD L homes, compared to 55.7 per cent of recent 2011 TGD L homes – a drop of 37.3 per cent. Mechanical extract ventilation features in 51.6 per cent of homes (+21 per cent), with heat recovery ventilation in 17 per cent (-4.6 per cent), and natural ventilation at 16.8 per cent (-27.8 per cent). A further 17 per cent have no ventilation system specified – due to a data transfer issue in the BER Research Tool – but are believed to represent exhaust air heat pumps, the ventilation element of which is treated differently in DEAP, the software used to calculate BERs and Part L compliance.
PV decline
A substantial decline in the use of renewable electricity microgenerators – a category almost entirely dominated by solar photovoltaic systems – is evident in the data, a consequence of the rise of heat pumps. Microgenerator market share has dropped from 41.5 per cent of homes built to TGD L 2011 down to 18.5 per cent of homes built to TGD L 2019. A relatively small solar PV array was commonly used as a route to satisfy the renewable energy target under TGD L 2011, enabling developers to continue to use gas boilers in gas grid areas.
Changes in the treatment of heat pumps in DEAP, combined with a change in how the requirement for renewables is expressed in TGD L from a primary energy contribution of 10 kWh/m2/yr to a 20 per cent renewable energy ratio, plus tighter overall energy performance targets, appear to have tipped the market decisively in favour of heat pumps over the gas and PV option.
Airtightness levels have improved from an average q50 of 2.81 to 2.55 m3/hr/m2 at 50 Pascals. U-values for walls and roofs are essentially unchanged at 0.175 and 0.134 respectively, with floors dropping from 0.14 to 0.134. (For floor and roof U-values, the analysis omitted entries of zero, which correspond to a ceiling or floor to another heated space, typically in apartment buildings). Window U-values have dropped from 1.21 to 1.167, with doors dropping from 1.3 to 1.15.
Y-values are also largely unchanged – 66.5 per cent of TGD L 2019 homes are using a Y-value of 0.08 (+1.1 per cent), indicating use of the Acceptable Construction Details, with 23.9 per cent (-2.1 per cent) using the default of 0.15. This indicates that less than 10 per cent of BERs include a calculated Y-value – meaning a potentially significant cost reduction option may be being missed. (Given that, if a building has a default Y-value of 0.15, DEAP would effectively regard the heat loss of each element as increasing by 0.15 W/m2K, requiring the use of more insulation to meet performance targets).
Timber frame is listed as the first wall type in 31.9 per cent (+8.6 per cent) of TGD L 2019 homes, with 25.4 per cent listed as cavity wall (-15.1 per cent).
Related items
-
 EU Electrification Action Plan to accelerate heat pump transition
 -
 A warts-and-all account of a landmark passive house conference
 -
 Life cycle assessment in construction and retrofit
 -
 Housing minister calls for faster retrofit to shield homes from energy shocks
 -
 Bio-based self-build fuses passive principles and clever shading proves heatwave-proof
 -
 Accessible Manchester retrofit delivers comfort and low bills